
Introduction
When it comes to pen testing projects, precisely identifying a target’s underlying technologies is trivial. Accurately identifying hundreds of thousands of technologies, on a continuous, ongoing basis, isn't.
Improving the human ability to efficiently digest and interpret thousands of targets, and their underlying technologies, requires the intelligent use of automation – making the efficacy of information gathering critical for success. We’ve found that we can lean on techniques used in machine learning (ML) and data mining to handle large amounts of data with the frequency expectations of “continuous” analysis. In this post, we’ll share our thoughts about how ML can help us keep up with constantly changing attack surfaces to help our clients keep ahead of attacks.
Knowing Is Half the War
When it comes to attack surface testing, the initial target enumeration and network reconnaissance activities must be thorough and accurate to ensure timely, relevant results. This foundation is what enables deeper, more comprehensive testing such as the concepts we’ll be covering later in this post.
To be useful for any organization, attack surface testing must continuously be monitored, enhanced, and refined so that the risks can be prioritized based on severity and impact. G.I. Joe may have taught us that "knowing is half the battle," but in our case, it's half the war ... as wars consist of many battles. Not only must we “win” each asset discovery battle, but we must take that inventory of attack surface intelligence, mine it, and search for the most impactful issues to win the war.
As we build, develop, and iterate on our new continuous attack surface technology Cosmos offering, we’re thinking about how ML can help us to search vast amounts of attack surface data for vulnerabilities as fast as possible. Using ML to identify, group, and prioritize assets enables our team of talented operators to hunt tirelessly for threats nestled deep within thousands upon thousands of targets in a way that scales. After all, without a robust platform, it’s a losing proposition to rely only on humans – no matter how large the crowd may be – to find the needle in a stack of needles.
Enter Machine Learning
Mentioning “artificial intelligence,” “blockchain,” and “machine learning” may make you victorious in buzzword bingo, but these terms have become so overused that they’re almost meaningless. Our principal data scientist, Greg Mortensen, sheds some light on a few data science concepts that we’re incorporating into our platform to help surface high-value issues as fast as possible to our team of operators.
Our Data
Cosmos’ continual testing generates a large body of data from targets spanning diverse organizations and industry segments. To build an effective attack surface vocabulary, and make this rich repository usable in our machine learning models and to make decisions based on its content, we need to transform the dataset.
On March 6th, 2020, Ori Zigindere provided an in-depth account about a vulnerability in Citrix appliances and how we used that intelligence to protect our customers. For this exercise, we are examining HTTP response body data (“responses”) captured by Cosmos. In Figure 1, we see a Samba configuration file retrieved by CAST that’s indicative of CVE-2019-19781.
[global]
    encrypt passwords = yes
    name resolve order = lmhosts wins host bcast
FIGURE 1 - A Samba configuration file retrieved by Cosmos
Any particular response uses only a small subset of the terms contained throughout the entire collection (“corpus”). Some terms, such as the word “the” in English, are so prevalent that they convey little interesting information. Others, like multi-word phrases, are dependent on context, word order or punctuation (“Let’s eat, Grandma.” vs. “Let’s eat Grandma!”), and some languages, such as Chinese, have no delimiters to mark word boundaries. With this in mind, how do we extract content that’s useful for further analysis?
Enter TF-IDF
Term Frequency - Inverse Document Frequency (TF-IDF), a weighting scheme conceived by Hans Peter Luhn (TF) and Karen Spärck Jones (IDF) and popular with recommender systems, measures the originality of a term. The number of times a term appears in a document (the term frequency) is compared with the number of documents that the term appears in (the inverse document frequency). Terms that occur in many documents (“the” from the previous example) are not as interesting for investigation as those that occur in fewer documents (“password”).
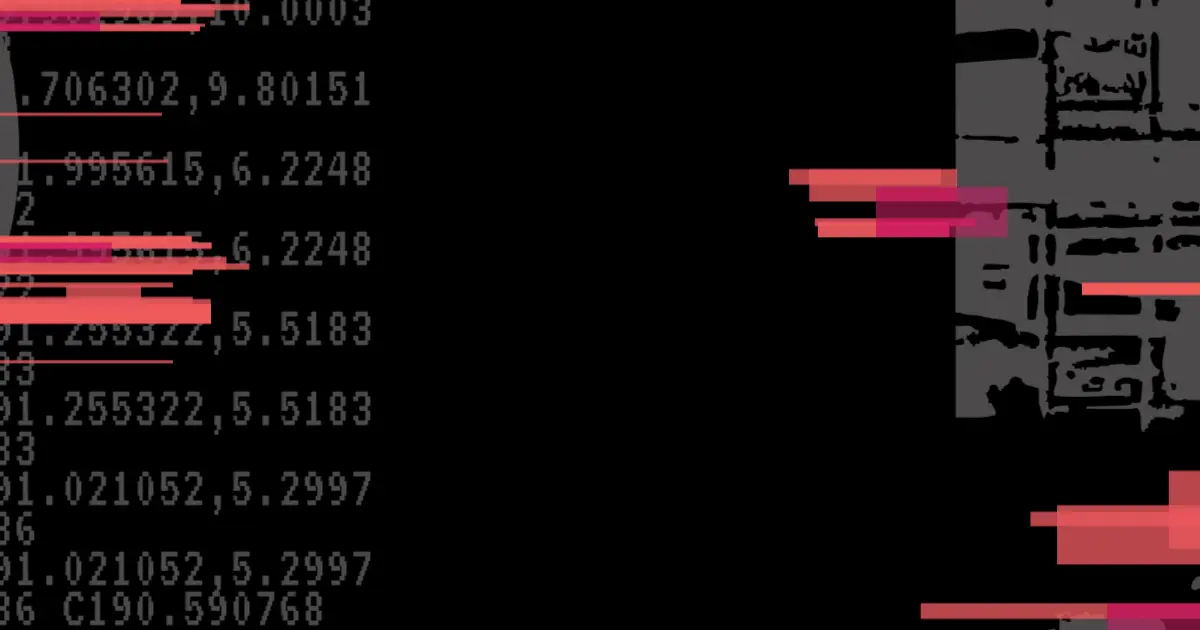
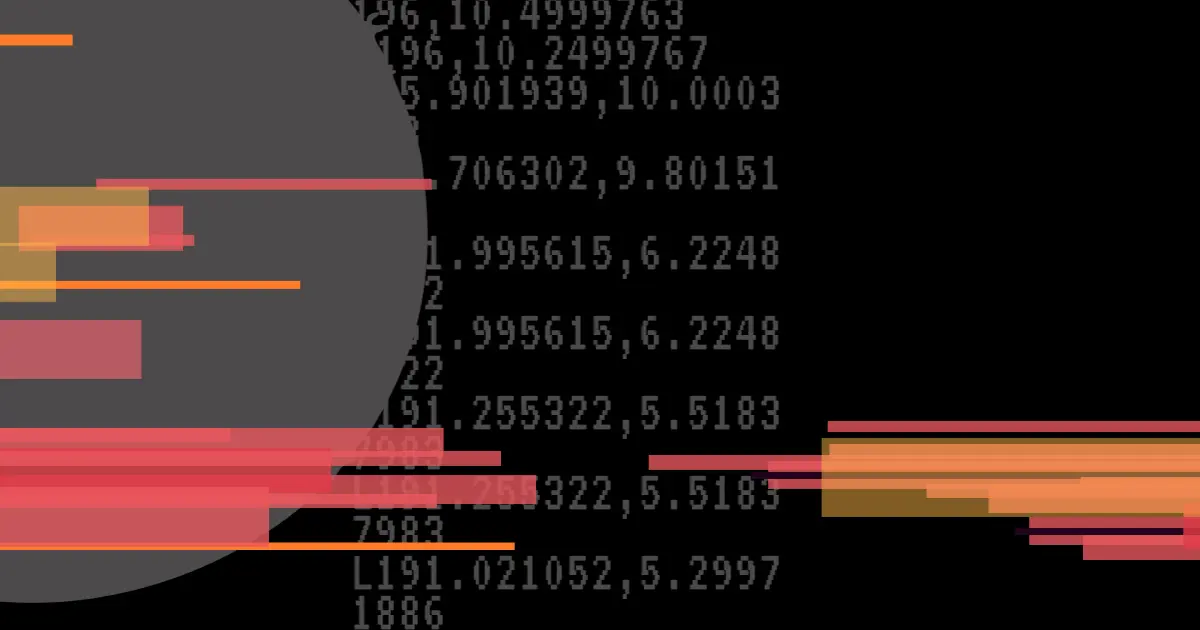
In Figure 2, we have applied TF-IDF to a sample dataset of 6,260 responses, and scored 15,930 distinct, interesting terms. Each row represents a specific response (“document”), and each column a term. The higher the TF-IDF score, the rarer the term and more relevant it is throughout the corpus. Terms that aren’t present in a particular document are represented with a 0, and most words contained in the corpus aren’t used in any particular document.

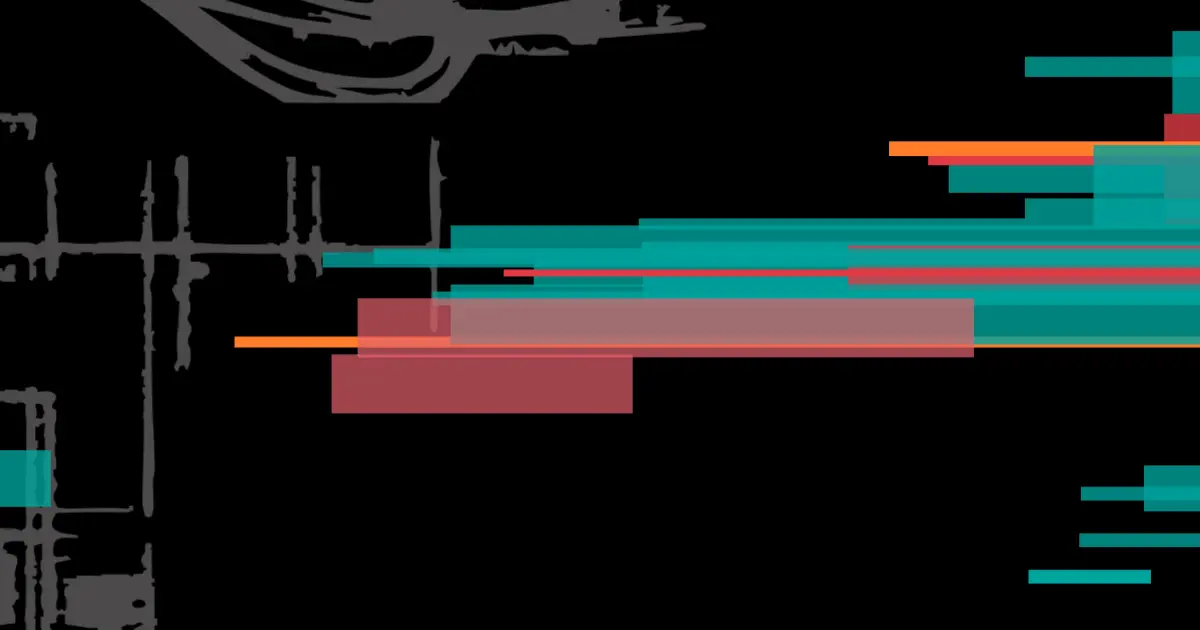
This results in a matrix of 99,721,800 elements that – with apologies to Douglas Adams and HHGTTG – is vastly, hugely, mind-bogglingly big. In Figure 3, we visualize this matrix. The plot shows that each document uses only a small portion of terms, which are pictured as blue dots. To make sense of these seemingly randomly distributed dots, we need to identify similarities between the documents and terms.

Enter Spectral Co-Clustering
I.S. Dhillon introduced two algorithms to simultaneously cluster documents and terms, grouping together like objects. Spectral Co‑Clustering finds clusters with values – TF-IDF weightings in this example – higher than those in other rows and columns. Each row and column belong to exactly one co-cluster. This is where things become exciting, at least from a data sciences perspective.
In Figure 4, two such groupings, after co-clustering was applied, are illustrated. The number of documents contained within each co-cluster is listed, along with the best terms (determined by comparing their values inside and outside the co‑cluster) used within that subset of documents.
cocluster 0 : 138 documents
words : yes name resolve order, lmhosts wins host bcast, …
…
cocluster 4 : 1537 documents
words : script, rdx, vpn, …
FIGURE 4 - Two co-clusters
Plotting the groupings reveals these co-clusters along the diagonal. In striking contrast to Figure 3, Figure 5 highlights the similarities – use of the same, distinct terms – from different servers.
When the results were manually reviewed, co-cluster 0 identified the relatively small collection of terms from CVE-2019-19781. Co‑cluster 4 (with a much larger collection of terms, indicated by its greater width) identified Citrix Netscaler appliances. As we progress, the machine will become better at identifying these patterns by considering inputs such as these for further analysis.

By leveraging these two techniques, massive amounts of data can be processed quickly, and new conclusions rise to the surface that may otherwise not be readily apparent. As we mentioned previously, one of our goals is to improve the human ability to digest and interpret thousands of targets efficiently through the intelligent use of automation. Where do we go from here?
What we learned throughout this research is that these techniques show promise in our ability to infer the presence of vulnerabilities without explicitly searching for them (a welcome change from the traditional signature-based model). In the future, we’re planning to find more ways to discover commonalities between classifiers and combine approaches to become even more efficient at finding vulnerability indicators. After all, the end goal is to become fully autonomous and empower the machine to seek out similar behaviors without human guidance or intervention.
In Summary
We began by stressing the importance of the initial information-gathering phase and why building a solid contextual understanding of assets that comprise an attack surface is a key success factor in uncovering impactful vulnerabilities.
Next, Greg introduced two concepts, TF-IDF and Spectral Co-Clustering, that we're actively incorporating into our Cosmos platform in order to efficiently process massive amounts of data to surface the most impactful issues. TF-IDF employs a term weighting scheme that enables a dataset to be plotted according to ubiquity and/or frequency. Greg also provided an example of unsupervised machine learning, Spectral Co-Clustering, to illustrate how relationships in co-clusters relating to CVE-2019-19781 were identified. Finally, we covered a few scenarios of where we think our research will take us next by leveraging these techniques.
One of the fascinating parts about working with data is you never know where the journey will take you. With that small disclaimer, future topics we hope to discuss include a deeper dive into terms like "attack surface" and "coverage" and why we need to revisit the current industry definition of each.
We’ll continue to share our findings on our blog as we encounter new and exciting insights, observations, or discoveries in our data.

Subscribe to our blog
Be first to learn about latest tools, advisories, and findings.
Thank You! You have been subscribed.
Recommended Posts
You might be interested in these related posts.